
Console Log Support
Syntax highlighting and hyperlinks are also supported for console output across the IDE, similar to how log files are viewed in the editor.
Supported Consoles
- Run/Debug
- Build tool window
- Services view (Docker, etc.)
- VCS Console
- Misc tool-window consoles, such as Database
Features
Syntax Highlighting
Log levels, timestamps, categories, and message constructs are highlighted using the same color scheme as log files. Colors are fully customizable - see Settings - Customizing Color Scheme.
Hyperlinks
File paths, URLs, and log categories or stack traces are converted to clickable hyperlinks:
Cmd+B | Ctrl+Bor click to follow- Stack traces navigate to source code when a matching project location is available
Toggling Console Display
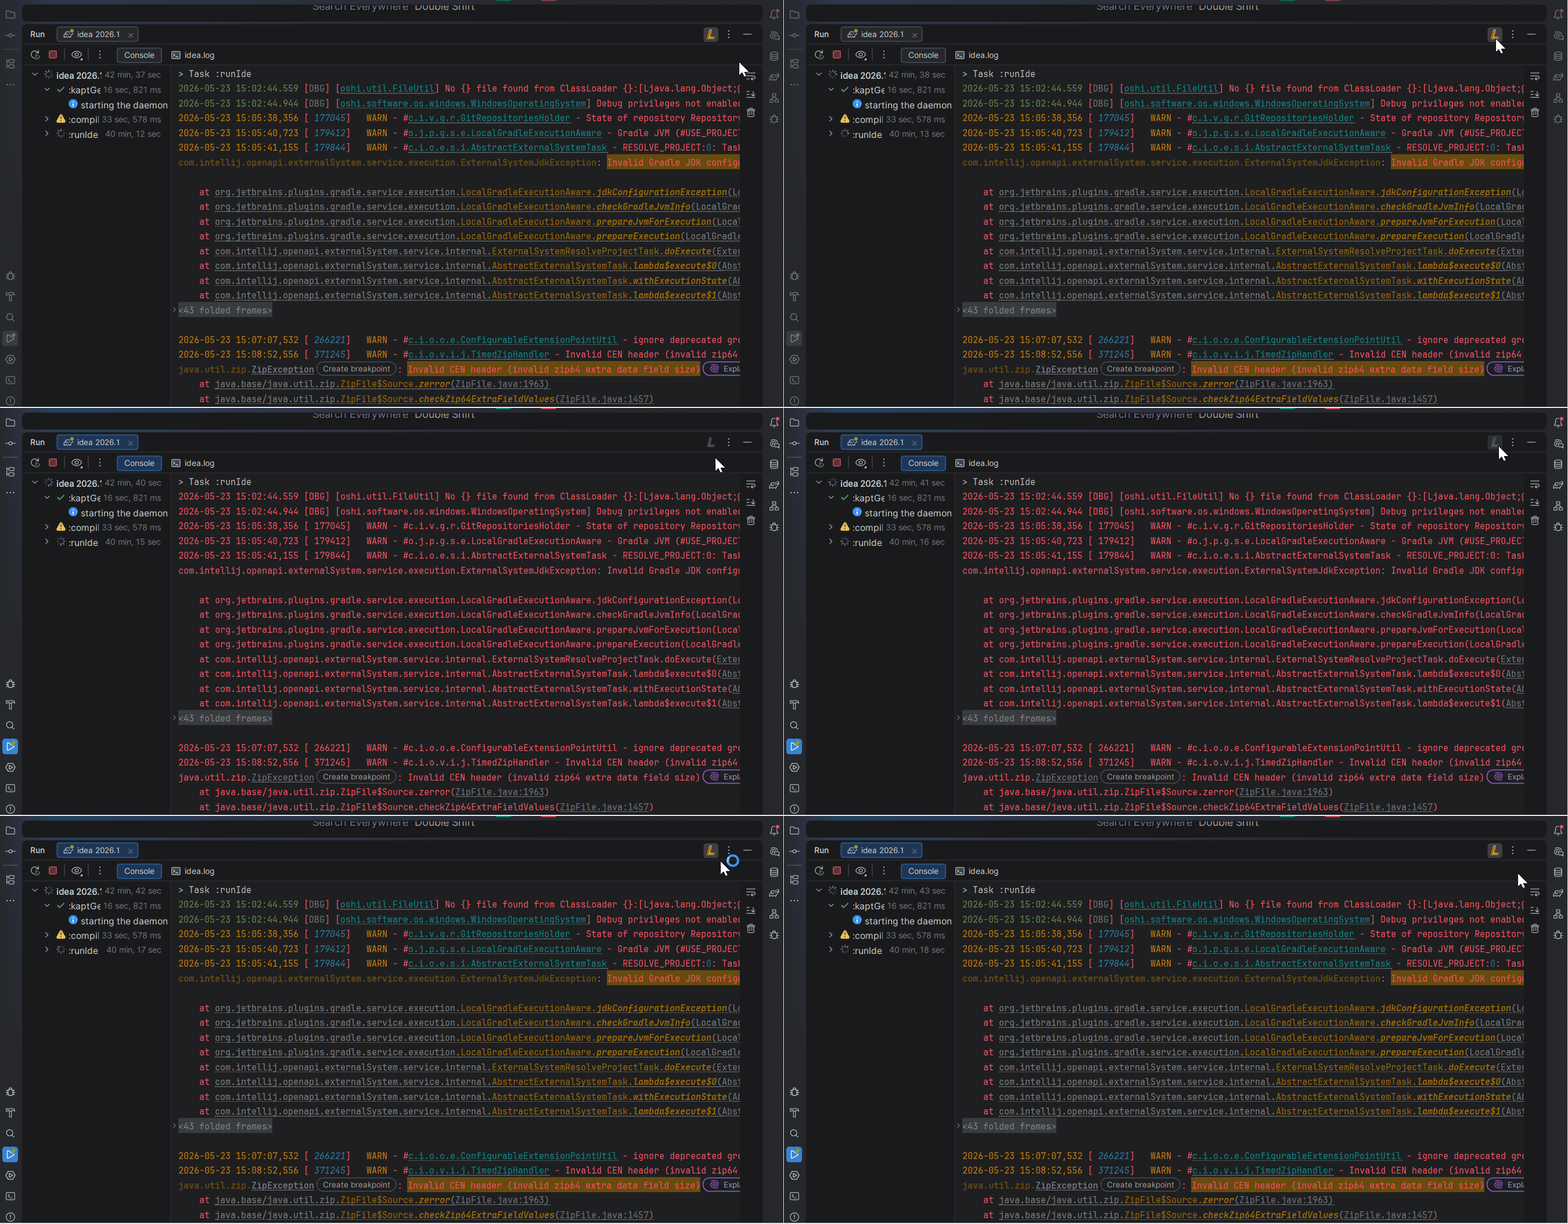
Each console has a View Console as Log toggle button on the relevant view title bar and in Find Action (Cmd+Shift+A | Ctrl+Shift+A). It is on by default.
JSON Console Logs
Human-Friendly JSON Logs
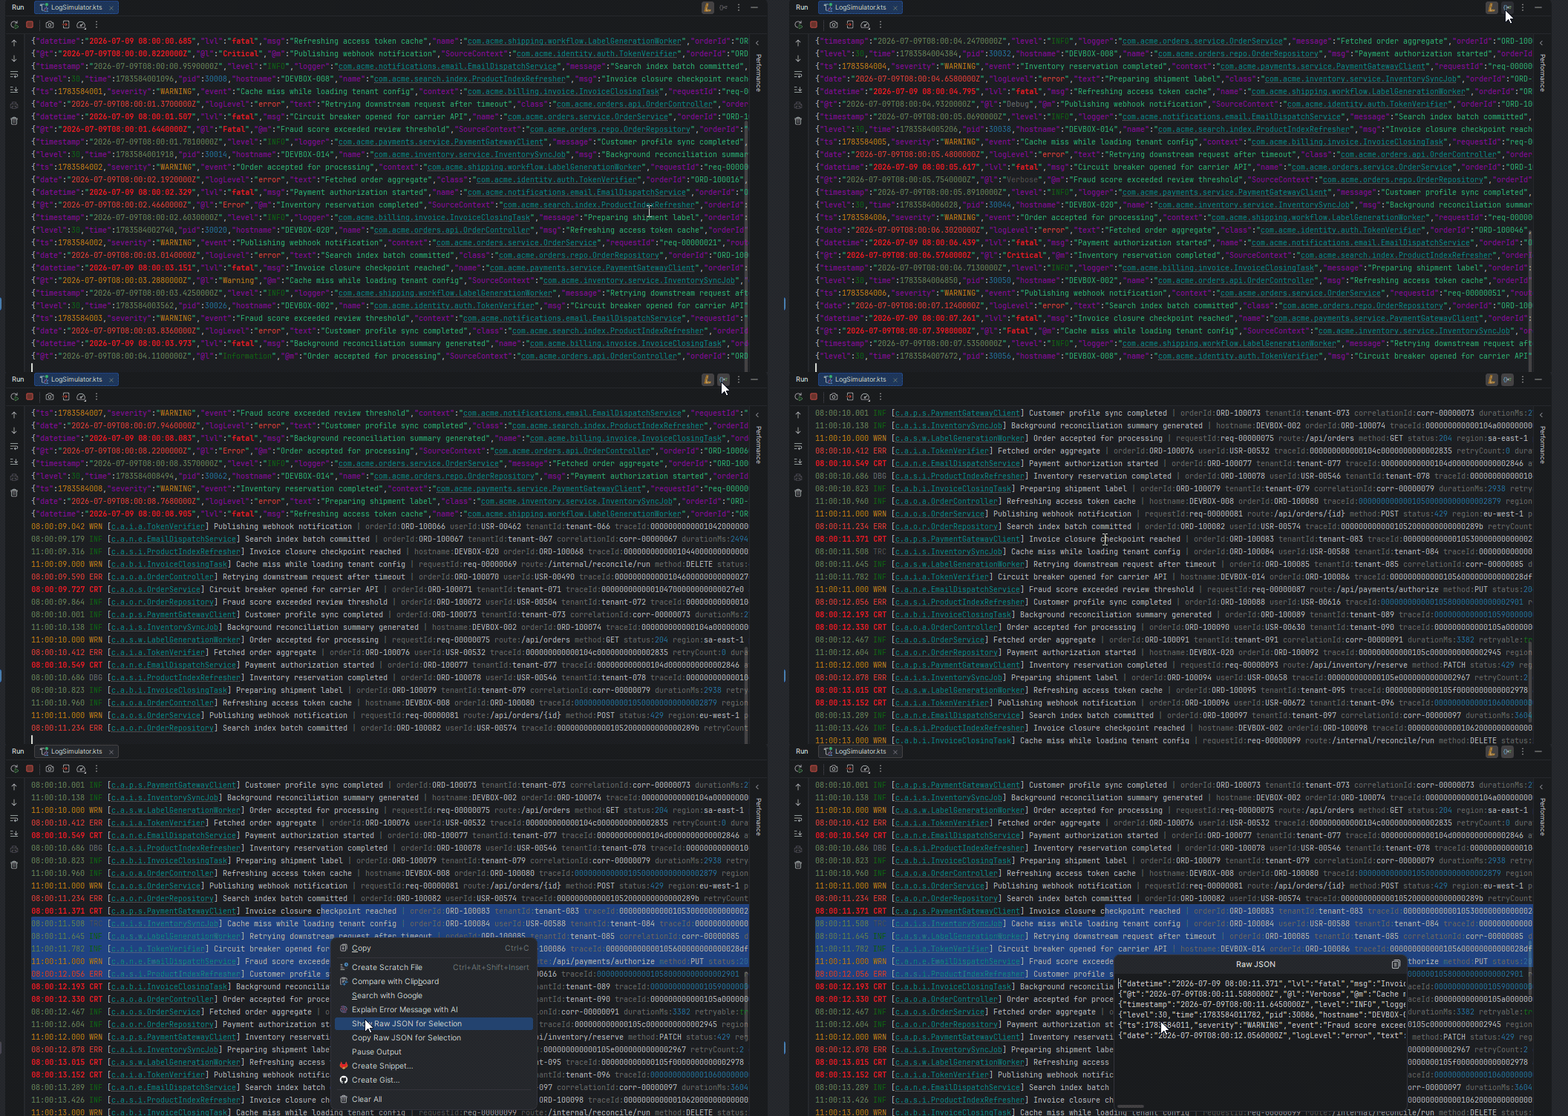
When console output contains structured JSON log events, .log can automatically convert them into a more readable one-line log summary. This helps when frameworks emit dense JSON objects instead of human-friendly log text.
The feature is enabled by default for new consoles and works independently from the main View Console as Log toggle.
When a JSON log event contains a recognized serialized stack trace in its exception data, .log expands it beneath the summary as regular console lines. This keeps stack frames readable and available for the usual highlighting and navigation.
JSON Toggle
Console views that support this feature expose a separate Destructure JSON console logs action.
- It appears alongside other console-related actions, including title-bar and action-search surfaces where supported.
- The JSON icon stays grey until JSON log output is detected in that console.
- Once JSON log lines are detected, the icon becomes active-looking even if the toggle is currently off.
Supported Console Views
JSON destructuring is designed for the same general console areas where .log enhances output:
- Run/Debug consoles
- Build output consoles
- Services view consoles
- Other supported IDE console views
Depending on the exact console implementation used by the IDE, some related UI details may vary slightly.
Raw JSON Access
Destructured console lines still keep the original raw JSON available from the console UI.
- Hovering a destructured line can show a raw JSON preview where the console supports hover tooltips.
- The context menu includes Show Raw JSON and Copy Raw JSON actions for destructured lines.
- Show Raw JSON opens the original JSON in a selectable popup, so it can be inspected or copied without losing the human-friendly console view.
Performance Limits
To keep console rendering responsive, very large JSON log lines are intentionally handled conservatively:
- JSON lines longer than 64 KB are not destructured.
- Converted output is capped at 8 KB and truncated when needed.
This is a performance and readability safeguard rather than an error state.
Forward-Only Behavior
The JSON destructuring toggle affects only new console output. Already printed lines are not re-rendered when the toggle changes.
Relationship to “View Console as Log”
View Console as Log controls the main log-style enhancements for console output, such as highlighting and hyperlinks. Destructure JSON console logs is a separate feature focused specifically on converting structured JSON log lines into a more readable format.
Note: Log highlighting and links are added on top of JetBrains IDE features, so the behavior is not always identical to how log files are displayed in the editor.